Example presentation

Open Statistical Programming

2025-01-01

Introduction

Welcome to this short Reveal.js presentation created with Quarto.

This presentation demonstrates how to combine text, R code, and visualizations into reproducible slides.

About the Data

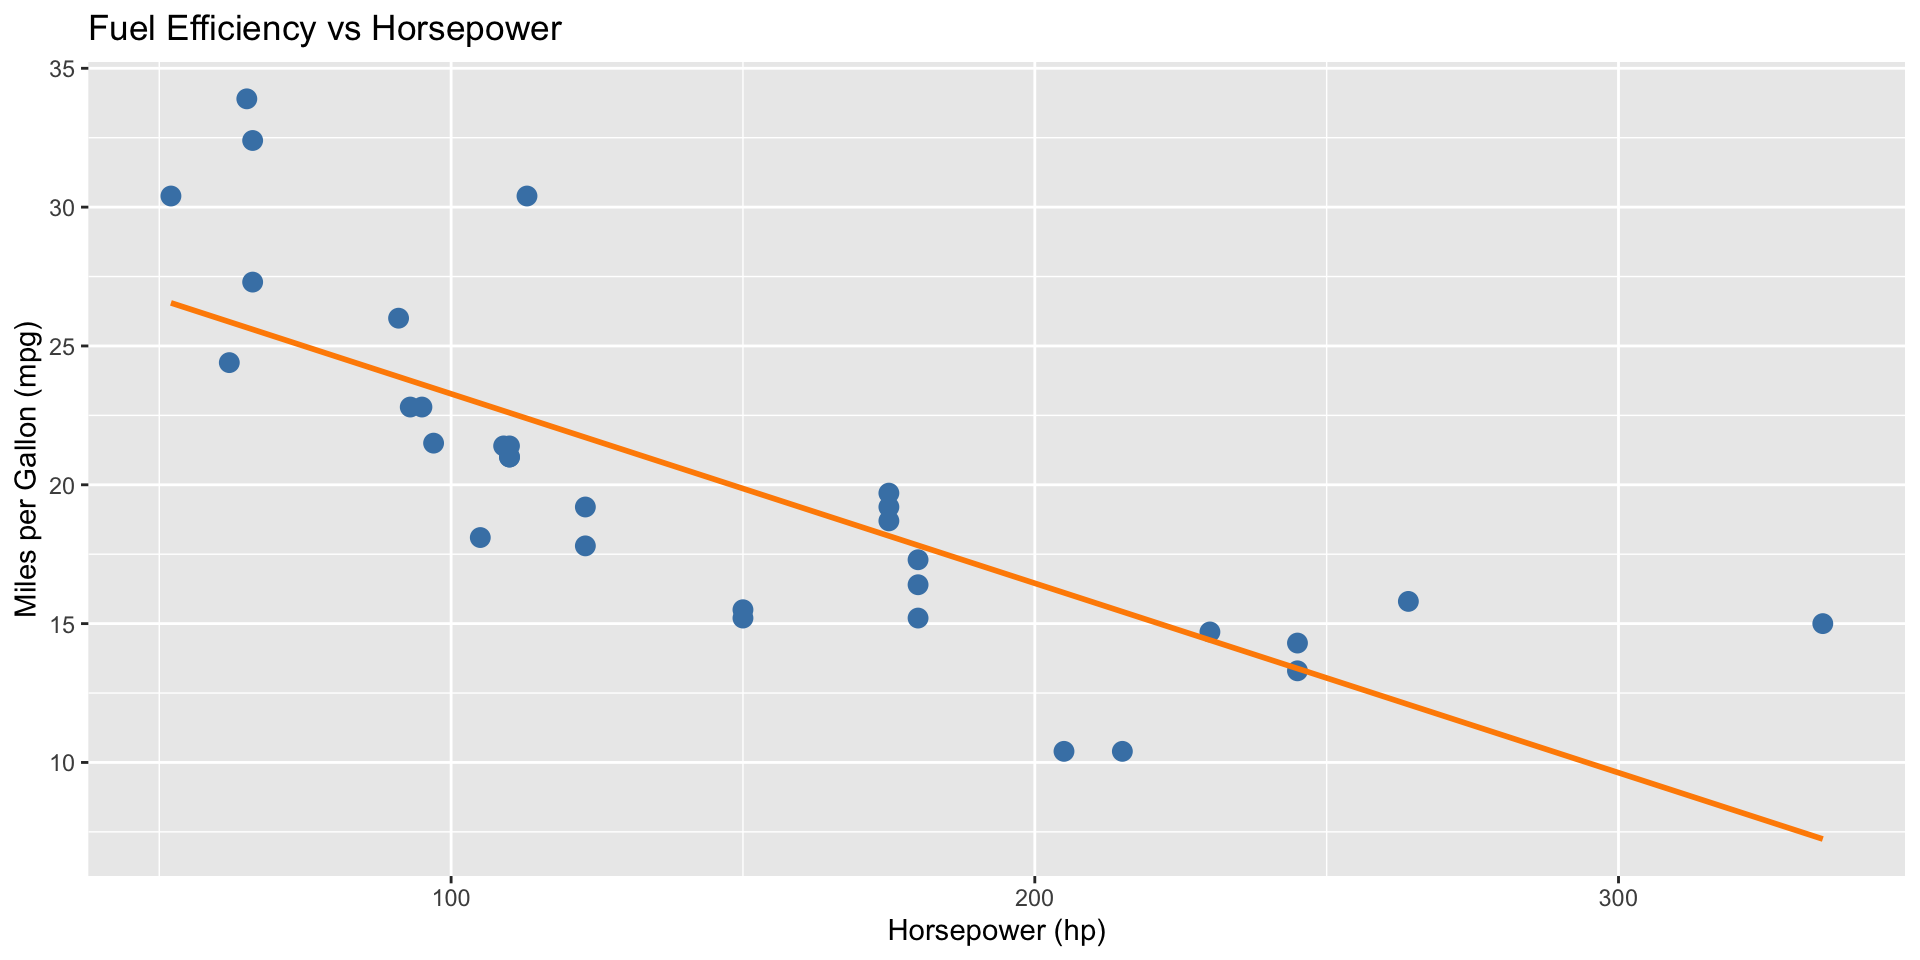
We’ll use the built-in mtcars dataset to explore the relationship between horsepower (hp) and fuel efficiency (mpg).

head(mtcars)
                   mpg cyl disp  hp drat    wt  qsec vs am gear carb
Mazda RX4         21.0   6  160 110 3.90 2.620 16.46  0  1    4    4
Mazda RX4 Wag     21.0   6  160 110 3.90 2.875 17.02  0  1    4    4
Datsun 710        22.8   4  108  93 3.85 2.320 18.61  1  1    4    1
Hornet 4 Drive    21.4   6  258 110 3.08 3.215 19.44  1  0    3    1
Hornet Sportabout 18.7   8  360 175 3.15 3.440 17.02  0  0    3    2
Valiant           18.1   6  225 105 2.76 3.460 20.22  1  0    3    1

Visualizing the Relationship

library(ggplot2)

ggplot(mtcars, aes(x = hp, y = mpg)) +
  geom_point(color = "steelblue", size = 3) +
  geom_smooth(method = "lm", se = FALSE, color = "darkorange") +
  labs(title = "Fuel Efficiency vs Horsepower",
       x = "Horsepower (hp)",
       y = "Miles per Gallon (mpg)")

Interpretation

  • Cars with higher horsepower generally have lower fuel efficiency.
  • The trend line shows a clear negative correlation between the two variables.
  • Such visualizations can support discussions in reports and presentations.

Summary

  • Markdown provides the structure and narrative.
  • R executes the analysis and visualization.
  • Quarto integrates both to produce polished slides.

Learn more: Reveal.js Presentations in Quarto