Excel Files

To wrap up our discussion of data-ingest methods, we’ll consider Microsoft Excel workbooks. Many datasets, especially those shared outside of academia, are stored and distributed as Excel workbooks. Thankfully, when you encounter such datasets, you’ll have no problems loading the data because several R packages allow us to work with Excel workbooks.

For quick-and-easy data-ingest from an Excel workbook, the readxl package is a good option. We can load data from an Excel workbook with the readxl::read_excel() function.

library(readxl)

dataDir <- "data"

titanic1 <- read_excel(here::here(dataDir, "example_data.xlsx"), sheet = "titanic")
head(titanic1)
# A tibble: 6 × 8
  survived class name        sex     age siblings_spouses parents_children  fare
  <chr>    <chr> <chr>       <chr> <dbl>            <dbl>            <dbl> <dbl>
1 no       3rd   Mr. Owen H… male     22                1                0  7.25
2 yes      1st   Mrs. John … fema…    38                1                0 71.3 
3 yes      3rd   Miss. Lain… fema…    26                0                0  7.92
4 yes      1st   Mrs. Jacqu… fema…    35                1                0 53.1 
5 no       3rd   Mr. Willia… male     35                0                0  8.05
6 no       3rd   Mr. James … male     27                0                0  8.46

Notice that we need to specify which sheet holds our target data via the sheet argument. If we don’t specify a value for the sheet argument, read_excel() will read from the first sheet in the workbook.

If we only need to load data, then readxl will usually suffice, but we won’t be able to save data back to an XLSX workbook with readxl functions. So, if we want to write data back to an Excel workbook, we should consider a using different package. The openxlsx package is a good option.

The procedure for reading data with openxlsx is almost identical to what we did with readxl. In this case, we use the openxslx::read.xlsx() function.

library(openxlsx)

titanic2 <- read.xlsx(here::here(dataDir, "example_data.xlsx"), sheet = "titanic")
head(titanic2)
  survived class                                               name    sex age
1       no   3rd                             Mr. Owen Harris Braund   male  22
2      yes   1st Mrs. John Bradley (Florence Briggs Thayer) Cumings female  38
3      yes   3rd                              Miss. Laina Heikkinen female  26
4      yes   1st        Mrs. Jacques Heath (Lily May Peel) Futrelle female  35
5       no   3rd                            Mr. William Henry Allen   male  35
6       no   3rd                                    Mr. James Moran   male  27
  siblings_spouses parents_children    fare
1                1                0  7.2500
2                1                0 71.2833
3                0                0  7.9250
4                1                0 53.1000
5                0                0  8.0500
6                0                0  8.4583

When we compare the two datasets, we see that they return functional equivalent objects. The only notable difference is that readxl::read_excel() returns a tibble while openxlsx::read.xlsx() returns a Base R data frame.

str(titanic1)
tibble [887 × 8] (S3: tbl_df/tbl/data.frame)
 $ survived        : chr [1:887] "no" "yes" "yes" "yes" ...
 $ class           : chr [1:887] "3rd" "1st" "3rd" "1st" ...
 $ name            : chr [1:887] "Mr. Owen Harris Braund" "Mrs. John Bradley (Florence Briggs Thayer) Cumings" "Miss. Laina Heikkinen" "Mrs. Jacques Heath (Lily May Peel) Futrelle" ...
 $ sex             : chr [1:887] "male" "female" "female" "female" ...
 $ age             : num [1:887] 22 38 26 35 35 27 54 2 27 14 ...
 $ siblings_spouses: num [1:887] 1 1 0 1 0 0 0 3 0 1 ...
 $ parents_children: num [1:887] 0 0 0 0 0 0 0 1 2 0 ...
 $ fare            : num [1:887] 7.25 71.28 7.92 53.1 8.05 ...
str(titanic2)
'data.frame':   887 obs. of  8 variables:
 $ survived        : chr  "no" "yes" "yes" "yes" ...
 $ class           : chr  "3rd" "1st" "3rd" "1st" ...
 $ name            : chr  "Mr. Owen Harris Braund" "Mrs. John Bradley (Florence Briggs Thayer) Cumings" "Miss. Laina Heikkinen" "Mrs. Jacques Heath (Lily May Peel) Futrelle" ...
 $ sex             : chr  "male" "female" "female" "female" ...
 $ age             : num  22 38 26 35 35 27 54 2 27 14 ...
 $ siblings_spouses: num  1 1 0 1 0 0 0 3 0 1 ...
 $ parents_children: num  0 0 0 0 0 0 0 1 2 0 ...
 $ fare            : num  7.25 71.28 7.92 53.1 8.05 ...
# Convert 'titanic1' from a tibble to an ordinary data frame
titanic1.2 <- as.data.frame(titanic1)

# Are the two objects equivalent?
all.equal(titanic1.2, titanic2)
[1] TRUE
Practice

Use both readxl::read_excel() and openxlsx::read.xlsx() to load the data from the “diabetes” sheet in the Excel workbook stored as “./data/example_data.xlsx”.

The following dendrogram illustrates the structure of the working directory for this webr session.

diabetes1 <- read_excel(here::here("data", "example_data.xlsx"),
                        sheet = "diabetes")
head(diabetes1)
# A tibble: 6 × 11
    age   bmi    bp    tc   ldl   hdl   tch   ltg   glu progress sex   
  <dbl> <dbl> <dbl> <dbl> <dbl> <dbl> <dbl> <dbl> <dbl>    <dbl> <chr> 
1    59  32.1   101   157  93.2    38     4  4.86    87      151 male  
2    48  21.6    87   183 103.     70     3  3.89    69       75 female
3    72  30.5    93   156  93.6    41     4  4.67    85      141 male  
4    24  25.3    84   198 131.     40     5  4.89    89      206 female
5    50  23     101   192 125.     52     4  4.29    80      135 female
6    23  22.6    89   139  64.8    61     2  4.19    68       97 female
diabetes2 <- read.xlsx(here::here("data", "example_data.xlsx"),
                      sheet = "diabetes")
head(diabetes2)
  age  bmi  bp  tc   ldl hdl tch    ltg glu progress    sex
1  59 32.1 101 157  93.2  38   4 4.8598  87      151   male
2  48 21.6  87 183 103.2  70   3 3.8918  69       75 female
3  72 30.5  93 156  93.6  41   4 4.6728  85      141   male
4  24 25.3  84 198 131.4  40   5 4.8903  89      206 female
5  50 23.0 101 192 125.4  52   4 4.2905  80      135 female
6  23 22.6  89 139  64.8  61   2 4.1897  68       97 female

Loading Specific Cells

In addition to selecting the sheet from which we want to read our dataset, we can also specify the range of cells within that sheet that we want to read. This capability is particularly useful because Excel workbooks are typically organized as interactive spreadsheets that include additional, arbitrarily organized metadata cells and formula cells. These additional cells often violate the regular grid structure that we assume for a rectangular datasets.

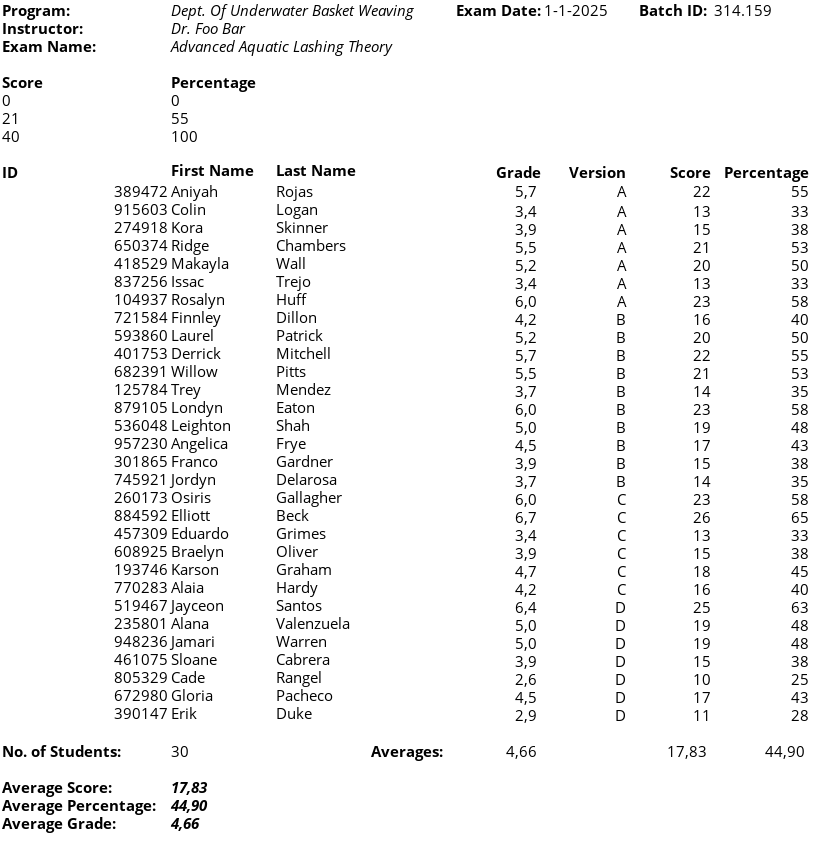
For example, the following image shows the “exam_results” sheet from the “./data/example_data.xlsx” workbook. This sheet contains an interactive spreadsheet that summarizes the results of a hypothetical exam. Notice how the sheet contains nine leading rows and six trailing rows of metadata surrounding the 31 rows of individual exam results (and column names). If we’re interested in the individual exam results, the extra metadata rows will cause problems.

If we try to read all the data in this sheet, we get the following results.

res1 <- read_excel(here::here(dataDir, "example_data.xlsx"),
                   sheet = "exam_results")
res1
# A tibble: 45 × 8
   `Program:`  Dept. Of Underwater Basket Wea…¹ ...3  ...4  `Exam Date:` `45658`
   <chr>       <chr>                            <chr> <chr> <chr>        <chr>  
 1 Instructor: Dr. Foo Bar                      <NA>  <NA>  <NA>         <NA>   
 2 Exam Name:  Advanced Aquatic Lashing Theory  <NA>  <NA>  <NA>         <NA>   
 3 <NA>        <NA>                             <NA>  <NA>  <NA>         <NA>   
 4 Score       Percentage                       <NA>  <NA>  <NA>         <NA>   
 5 0           0                                <NA>  <NA>  <NA>         <NA>   
 6 21          55                               <NA>  <NA>  <NA>         <NA>   
 7 40          100                              <NA>  <NA>  <NA>         <NA>   
 8 <NA>        <NA>                             <NA>  <NA>  <NA>         <NA>   
 9 ID          First Name                       Last… <NA>  Grade        Version
10 389472      Aniyah                           Rojas <NA>  5.7          A      
# ℹ 35 more rows
# ℹ abbreviated name: ¹​`Dept. Of Underwater Basket Weaving`
# ℹ 2 more variables: `Batch ID:` <chr>, `314159` <chr>
colnames(res1)
[1] "Program:"                           "Dept. Of Underwater Basket Weaving"
[3] "...3"                               "...4"                              
[5] "Exam Date:"                         "45658"                             
[7] "Batch ID:"                          "314159"                            
res2 <- read.xlsx(here::here(dataDir, "example_data.xlsx"),
                  sheet = "exam_results")
res2
              Program: Dept..Of.Underwater.Basket.Weaving         X3        X4
1          Instructor:                        Dr. Foo Bar       <NA>      <NA>
2           Exam Name:    Advanced Aquatic Lashing Theory       <NA>      <NA>
3                Score                         Percentage       <NA>      <NA>
4                    0                                  0       <NA>      <NA>
5                   21                                 55       <NA>      <NA>
6                   40                                100       <NA>      <NA>
7                   ID                         First Name  Last Name      <NA>
8               389472                             Aniyah      Rojas      <NA>
9               915603                              Colin      Logan      <NA>
10              274918                               Kora    Skinner      <NA>
11              650374                              Ridge   Chambers      <NA>
12              418529                            Makayla       Wall      <NA>
13              837256                              Issac      Trejo      <NA>
14              104937                            Rosalyn       Huff      <NA>
15              721584                            Finnley     Dillon      <NA>
16              593860                             Laurel    Patrick      <NA>
17              401753                            Derrick   Mitchell      <NA>
18              682391                             Willow      Pitts      <NA>
19              125784                               Trey     Mendez      <NA>
20              879105                             Londyn      Eaton      <NA>
21              536048                           Leighton       Shah      <NA>
22              957230                           Angelica       Frye      <NA>
23              301865                             Franco    Gardner      <NA>
24              745921                             Jordyn   Delarosa      <NA>
25              260173                             Osiris  Gallagher      <NA>
26              884592                            Elliott       Beck      <NA>
27              457309                            Eduardo     Grimes      <NA>
28              608925                            Braelyn     Oliver      <NA>
29              193746                             Karson     Graham      <NA>
30              770283                              Alaia      Hardy      <NA>
31              519467                            Jayceon     Santos      <NA>
32              235801                              Alana Valenzuela      <NA>
33              948236                             Jamari     Warren      <NA>
34              461075                             Sloane    Cabrera      <NA>
35              805329                               Cade     Rangel      <NA>
36              672980                             Gloria    Pacheco      <NA>
37              390147                               Erik       Duke      <NA>
38    No. of Students:                                 30       <NA> Averages:
39      Average Score:                   17.8333333333333       <NA>      <NA>
40 Average Percentage:                               44.9       <NA>      <NA>
41      Average Grade:                   4.65666666666667       <NA>      <NA>
         Exam.Date:   45658        Batch.ID:     314159
1              <NA>    <NA>             <NA>       <NA>
2              <NA>    <NA>             <NA>       <NA>
3              <NA>    <NA>             <NA>       <NA>
4              <NA>    <NA>             <NA>       <NA>
5              <NA>    <NA>             <NA>       <NA>
6              <NA>    <NA>             <NA>       <NA>
7             Grade Version            Score Percentage
8               5.7       A               22         55
9               3.4       A               13         33
10              3.9       A               15         38
11              5.5       A               21         53
12              5.2       A               20         50
13              3.4       A               13         33
14                6       A               23         58
15              4.2       B               16         40
16              5.2       B               20         50
17              5.7       B               22         55
18              5.5       B               21         53
19              3.7       B               14         35
20                6       B               23         58
21                5       B               19         48
22              4.5       B               17         43
23              3.9       B               15         38
24              3.7       B               14         35
25                6       C               23         58
26              6.7       C               26         65
27              3.4       C               13         33
28              3.9       C               15         38
29              4.7       C               18         45
30              4.2       C               16         40
31              6.4       D               25         63
32                5       D               19         48
33                5       D               19         48
34              3.9       D               15         38
35              2.6       D               10         25
36              4.5       D               17         43
37              2.9       D               11         28
38 4.65666666666667    <NA> 17.8333333333333       44.9
39             <NA>    <NA>             <NA>       <NA>
40             <NA>    <NA>             <NA>       <NA>
41             <NA>    <NA>             <NA>       <NA>
colnames(res2)
[1] "Program:"                           "Dept..Of.Underwater.Basket.Weaving"
[3] "X3"                                 "X4"                                
[5] "Exam.Date:"                         "45658"                             
[7] "Batch.ID:"                          "314159"                            

The extra metadata rows break the rectangular grid structure and interfere with our ability to access the individual exam results. Furthermore, the first row of metadata is interpreted as column names, which doesn’t make any sense in this case.

Fortunately, both read_excel() and read.xlsx() provide options for restricting the range of cells that we read. In the following code chunks, we use the range and rows arguments to read only the rectangular grid of individual exam results.

res1 <- read_excel(here::here(dataDir, "example_data.xlsx"),
                   sheet = "exam_results",
                   range = "A10:H30")
res1
# A tibble: 20 × 8
       ID `First Name` `Last Name` ...4  Grade Version Score Percentage
    <dbl> <chr>        <chr>       <lgl> <dbl> <chr>   <dbl>      <dbl>
 1 389472 Aniyah       Rojas       NA      5.7 A          22         55
 2 915603 Colin        Logan       NA      3.4 A          13         33
 3 274918 Kora         Skinner     NA      3.9 A          15         38
 4 650374 Ridge        Chambers    NA      5.5 A          21         53
 5 418529 Makayla      Wall        NA      5.2 A          20         50
 6 837256 Issac        Trejo       NA      3.4 A          13         33
 7 104937 Rosalyn      Huff        NA      6   A          23         58
 8 721584 Finnley      Dillon      NA      4.2 B          16         40
 9 593860 Laurel       Patrick     NA      5.2 B          20         50
10 401753 Derrick      Mitchell    NA      5.7 B          22         55
11 682391 Willow       Pitts       NA      5.5 B          21         53
12 125784 Trey         Mendez      NA      3.7 B          14         35
13 879105 Londyn       Eaton       NA      6   B          23         58
14 536048 Leighton     Shah        NA      5   B          19         48
15 957230 Angelica     Frye        NA      4.5 B          17         43
16 301865 Franco       Gardner     NA      3.9 B          15         38
17 745921 Jordyn       Delarosa    NA      3.7 B          14         35
18 260173 Osiris       Gallagher   NA      6   C          23         58
19 884592 Elliott      Beck        NA      6.7 C          26         65
20 457309 Eduardo      Grimes      NA      3.4 C          13         33
colnames(res1)
[1] "ID"         "First Name" "Last Name"  "...4"       "Grade"     
[6] "Version"    "Score"      "Percentage"
res2 <- read.xlsx(here::here(dataDir, "example_data.xlsx"),
                  sheet = "exam_results",
                  rows = 10:40)
res2
       ID First.Name  Last.Name Grade Version Score Percentage
1  389472     Aniyah      Rojas   5.7       A    22         55
2  915603      Colin      Logan   3.4       A    13         33
3  274918       Kora    Skinner   3.9       A    15         38
4  650374      Ridge   Chambers   5.5       A    21         53
5  418529    Makayla       Wall   5.2       A    20         50
6  837256      Issac      Trejo   3.4       A    13         33
7  104937    Rosalyn       Huff   6.0       A    23         58
8  721584    Finnley     Dillon   4.2       B    16         40
9  593860     Laurel    Patrick   5.2       B    20         50
10 401753    Derrick   Mitchell   5.7       B    22         55
11 682391     Willow      Pitts   5.5       B    21         53
12 125784       Trey     Mendez   3.7       B    14         35
13 879105     Londyn      Eaton   6.0       B    23         58
14 536048   Leighton       Shah   5.0       B    19         48
15 957230   Angelica       Frye   4.5       B    17         43
16 301865     Franco    Gardner   3.9       B    15         38
17 745921     Jordyn   Delarosa   3.7       B    14         35
18 260173     Osiris  Gallagher   6.0       C    23         58
19 884592    Elliott       Beck   6.7       C    26         65
20 457309    Eduardo     Grimes   3.4       C    13         33
21 608925    Braelyn     Oliver   3.9       C    15         38
22 193746     Karson     Graham   4.7       C    18         45
23 770283      Alaia      Hardy   4.2       C    16         40
24 519467    Jayceon     Santos   6.4       D    25         63
25 235801      Alana Valenzuela   5.0       D    19         48
26 948236     Jamari     Warren   5.0       D    19         48
27 461075     Sloane    Cabrera   3.9       D    15         38
28 805329       Cade     Rangel   2.6       D    10         25
29 672980     Gloria    Pacheco   4.5       D    17         43
30 390147       Erik       Duke   2.9       D    11         28
colnames(res2)
[1] "ID"         "First.Name" "Last.Name"  "Grade"      "Version"   
[6] "Score"      "Percentage"

That’s better! Now, we have nice rectangular data frames containing only the interesting data.

Practice
  1. Use the openxlsx::read.xlsx() function to load the first 100 rows (not counting column names) of the first 4 columns from the ‘diabetes’ sheet in the Excel workbook stored as “./data/example_data.xlsx”.
  2. Use the readxl::read_excel() function with an appropriate specification for the range argument to load the chunk of data beginning on Row 3 and Column 2 and ending on Row 100 and Column 7 from the ‘titanic’ sheet in “./data/example_data.xlsx”.

The following dendrogram illustrates the structure of the working directory for this webr session.

diabetes <- read.xlsx(here::here("data", "example_data.xlsx"),
                      sheet = "diabetes",
                      rows = 1:101,
                      cols = 1:4)
head(diabetes)
  age  bmi  bp  tc
1  59 32.1 101 157
2  48 21.6  87 183
3  72 30.5  93 156
4  24 25.3  84 198
5  50 23.0 101 192
6  23 22.6  89 139
titanic3 <- read_excel(here::here("data", "example_data.xlsx"),
                       sheet = "titanic",
                       range = "B3:G100",
                       col_names = FALSE)
head(titanic3)
# A tibble: 6 × 6
  ...1  ...2                                             ...3   ...4  ...5  ...6
  <chr> <chr>                                            <chr> <dbl> <dbl> <dbl>
1 1st   Mrs. John Bradley (Florence Briggs Thayer) Cumi… fema…    38     1     0
2 3rd   Miss. Laina Heikkinen                            fema…    26     0     0
3 1st   Mrs. Jacques Heath (Lily May Peel) Futrelle      fema…    35     1     0
4 3rd   Mr. William Henry Allen                          male     35     0     0
5 3rd   Mr. James Moran                                  male     27     0     0
6 1st   Mr. Timothy J McCarthy                           male     54     0     0

NOTE: In the read_excel() call, we set col_names = FALSE to keep the function from converting the first row of data into column names.

Back to top