library(ggplot2)
data <- data.frame(
Group = c("A", "B", "C"),
Score = c(5.2, 6.8, 4.9)
)
ggplot(data, aes(x = Group, y = Score, fill = Group)) +
geom_bar(stat = "identity") +
theme_minimal()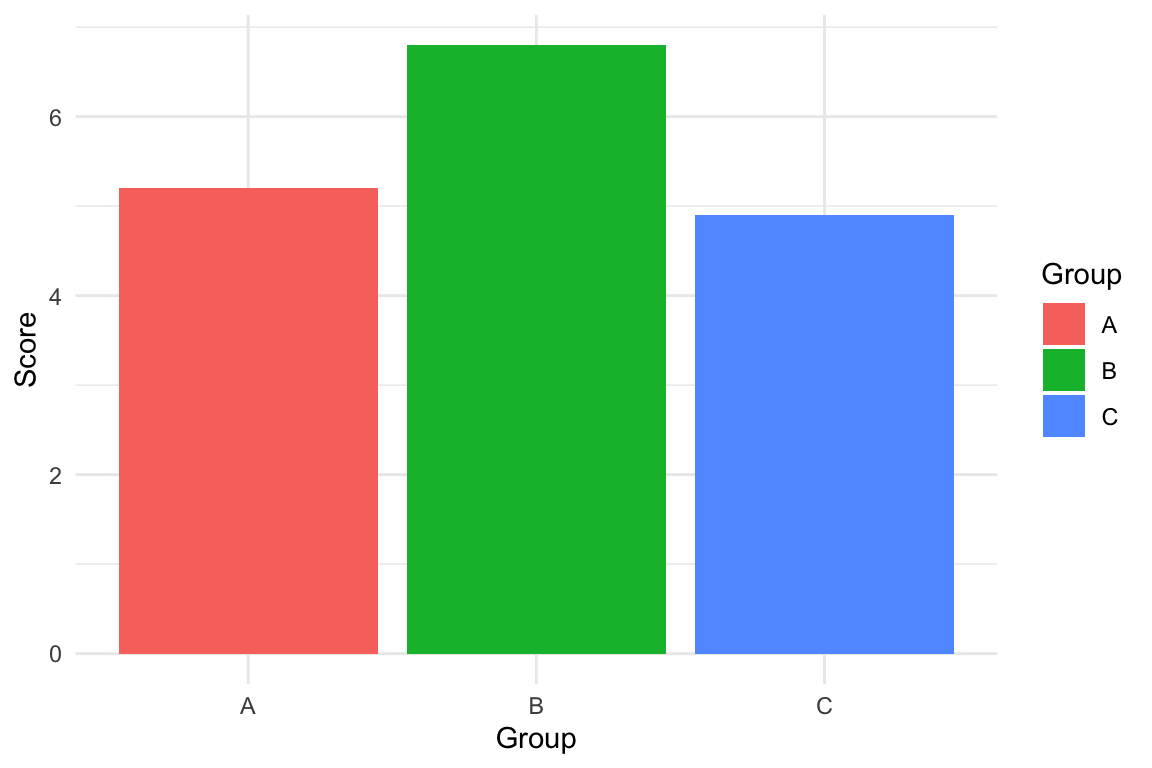
Figures are essential for visualizing data, illustrating concepts, or enhancing your reports. Quarto supports figures generated from R code as well as external images, allowing you to control captions, size, and placement for a polished presentation.
When creating plots in R, you can add captions and adjust figure size using chunk options in Quarto.
The options within your R chunk would be set like this:
#| label: fig-scores
#| fig-cap: "Boxplot of scores by group"
#| fig-width: 6
#| fig-height: 4
And with the following R code:
library(ggplot2)

data <- data.frame(
  Group = c("A", "B", "C"),
  Score = c(5.2, 6.8, 4.9)
)

ggplot(data, aes(x = Group, y = Score, fill = Group)) +
  geom_bar(stat = "identity") +
theme_minimal()This would then result in the figure as directly outputted after the code. Here, you see:
fig-cap: Adds a caption to the figure.fig-width and fig-height: Control the size of the rendered figure (in inches for HTML/PDF).label: Allows you to cross-reference the figure in text with @fig-scores: Ref to Figure 1.You can also combine fig-align: "center" in the chunk to center the figure in the output.
Quarto can include images stored locally or from the web using Markdown syntax:
Local images can be presented as follows:
{#fig-local width=50%}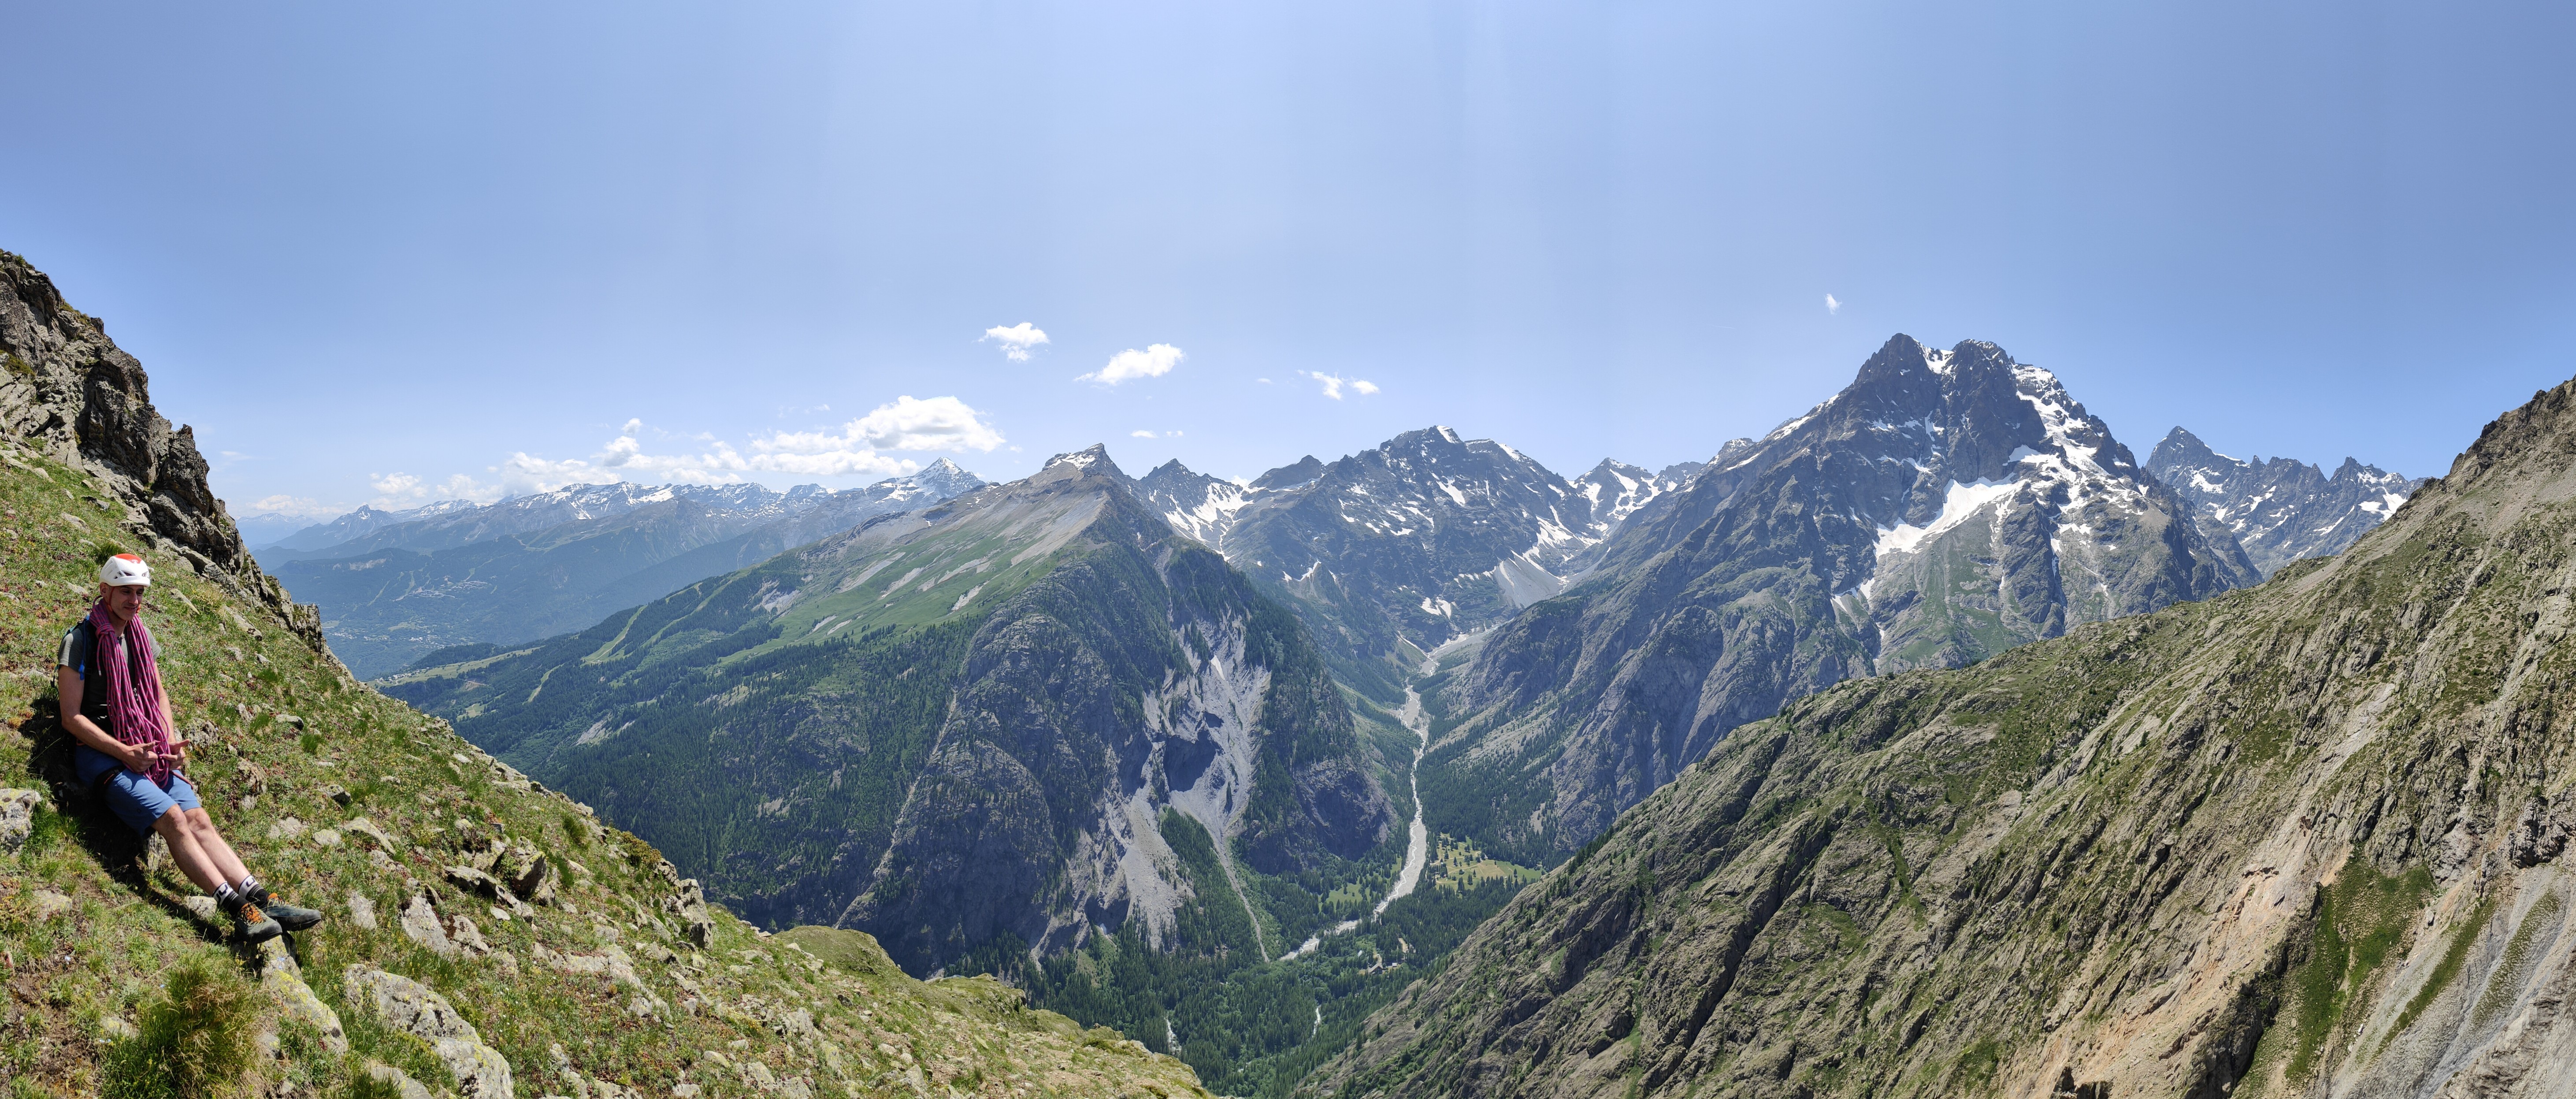
{#fig-local}: Assigns a label for cross-referencing using @fig-local: Figure 2.width=50%: Adjusts the display size relative to the output width.Web images can be presented by linking to them directly:
{width=200px}
width or height.#| label: for R plots or {#fig-label} for Markdown images to enable cross-referencing.fig-width/fig-height or CSS/Markdown size attributes to make sure figures are readable.Once a figure is labeled, you can refer to it in the text dynamically:
As shown in @fig-scores, group B has the highest score.Which will look as follows in text: As shown in Figure 1, group B has the highest score.
Quarto will automatically number the figure in the rendered document.
This approach allows you to seamlessly integrate data-driven plots, static images, and online resources while keeping your figures clean, readable, and fully reproducible.
For more detail, see the Quarto documentation