Quarto enables you to create a wide range of professional documents and presentations directly from RStudio. It builds on Markdown to combine code, text, and visualizations into a single reproducible workflow. This section introduces the basics of creating Quarto files, then explores the unique features and challenges of producing reports and presentations.
Basics: Working with Quarto in RStudio
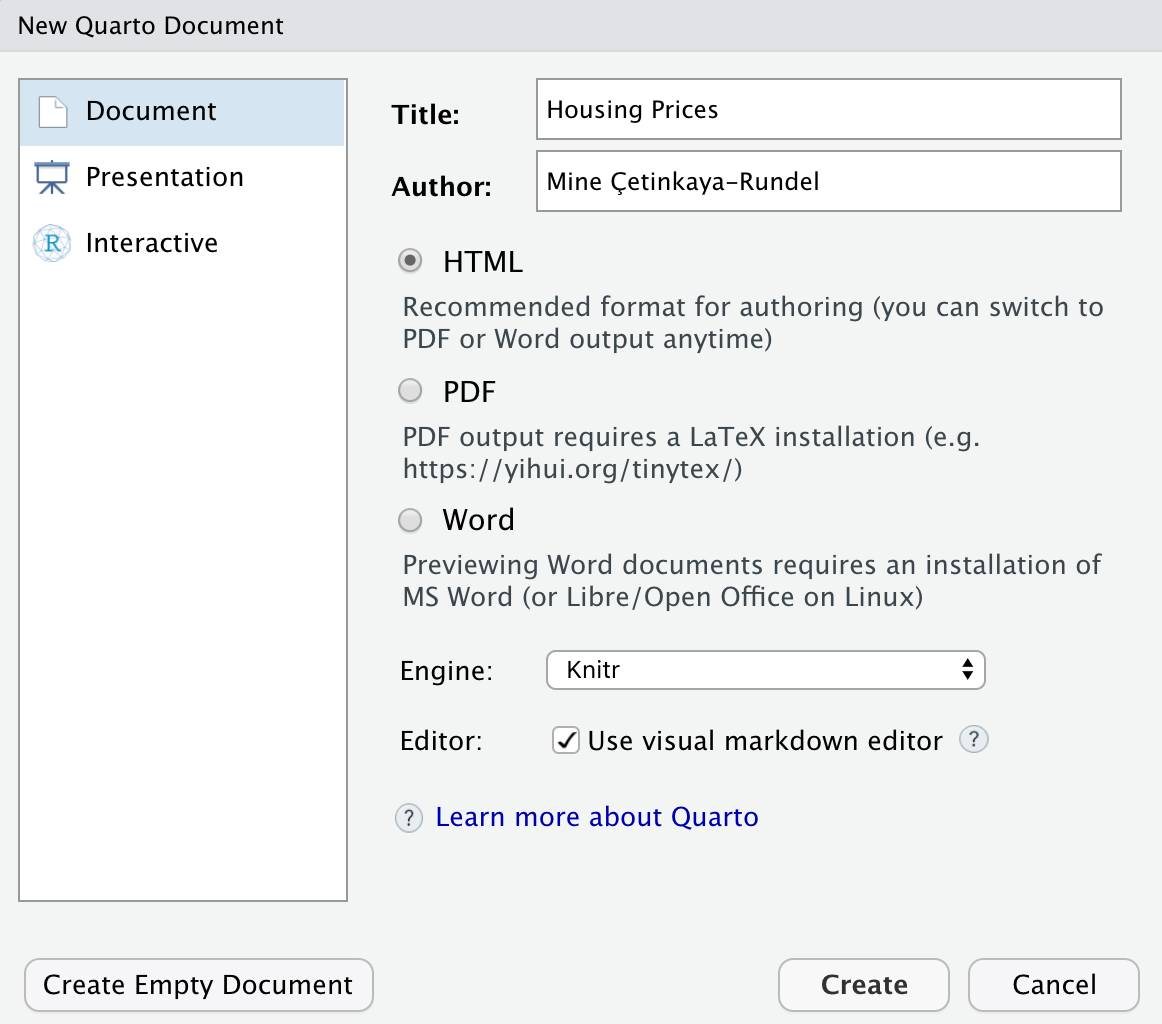
RStudio provides an integrated environment for writing and rendering Quarto documents. To start a new project:
Go to File → New File → Quarto Document…
In the dialog box, enter a title, author, and choose the default output format (e.g., HTML, PDF, or Word).
RStudio will create a .qmd file containing a template YAML header and example code chunk.
Click Render (or use Render on Save) to produce the formatted output.
RStudio Quarto new document dialog (source: https://quarto.org)
Reading
The screenshot above shows where to create new Quarto documents in RStudio. For more information, see the official Quarto documentation: 🔗 Authoring with RStudio – Quarto Documentation
A quarto file consists of:
A YAML header (between --- lines) defining metadata like title, author, date, and output type.
The body, written in Markdown syntax, possibly including embedded R code chunks using {r} blocks.
Optional format-specific settings for output style and behavior.
Of course — here’s a concise, textbook-style paragraph explaining YAML in the context of Quarto and RStudio:
YAML: Document Metadata and Configuration
At the top of every Quarto (.qmd) document is a section written in YAML (short for “YAML Ain’t Markup Language”). YAML provides a structured way to define metadata, such as information about the document like the title, author, date, and output format. It also controls global document options like table of contents, numbering, themes, or code execution settings. YAML uses a simple key–value structure, enclosed between three dashes (---) at the beginning and end of the block. For example:
---title:"Statistical Analysis of Air Quality Data"author:"Alex Rivera"date:"2025-01-01"format:html:toc:truecode-fold:true---
In this example, YAML instructs Quarto to render the document as an HTML report with a table of contents and collapsible code sections. While the Markdown and R layers handle what is written and how it’s computed, YAML defines how the entire document is presented and configured.
Language Layer
The language layer defines the written structure and formatting of a document using Markdown syntax. Markdown provides a simple and readable way to organize content through headings, lists, emphasis, links, and tables. It focuses entirely on text and structure, not on data or computation. In a Quarto document, this layer represents the narrative: the words, explanations, and organization that frame the analysis.
Example (Markdown text):
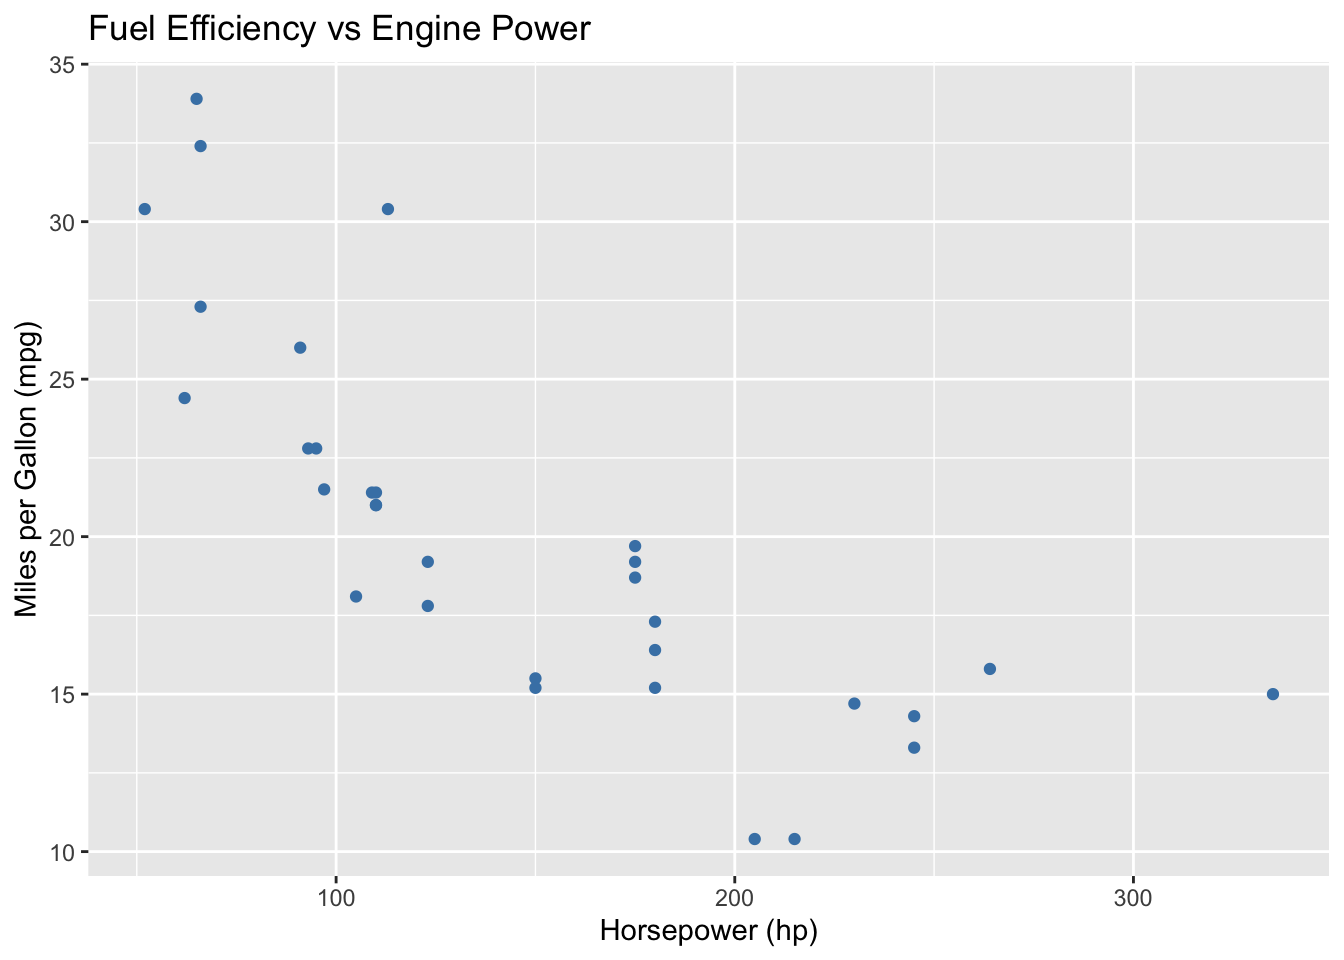
# Results and DiscussionIn this section, we summarize the findings from our dataset. The following figure illustrates the relationship between fuel efficiency and engine power.- Data collected from the *mtcars* dataset - Variables analyzed: **mpg** (miles per gallon) and **hp** (horsepower)
This text defines structure and emphasis but does not perform any computation.
Computation Layer
The computation layer carries out the actual data analysis and visualization. It involves embedding executable R code chunks inside the Markdown document, allowing results, tables, and figures to be generated automatically when the document is rendered. This integration ensures that all output is reproducible — every number and plot reflects the latest version of the data and analysis.
Example (R code chunk):
# Create a scatterplot of mpg vs horsepowerlibrary(ggplot2)ggplot(mtcars, aes(x = hp, y = mpg)) +geom_point(color ="steelblue") +labs(title ="Fuel Efficiency vs Engine Power",x ="Horsepower (hp)",y ="Miles per Gallon (mpg)")
When rendered through Quarto, this code runs in R, producing a plot that appears directly in the final document or presentation.
Creating Quarto Documents (Reports, Articles, and Papers)
Quarto supports a variety of document-based outputs, such as research reports, academic papers, and technical documentation. Common formats include:
Format
Output Type
Typical Use
html
Interactive web report
Exploratory data reports, dashboards
pdf
Print-quality report
Academic papers, formatted submissions
docx
Microsoft Word
Editable reports for collaboration
epub
e-book
Long-form reading materials
To create a document, specify the format in the YAML header:
Quarto automatically executes embedded R code chunks and inserts the resulting tables and plots. This enables reproducible research — every time you re-render, the analysis and visuals update from your current data.
Unique challenges and considerations for documents:
Layout and length: Reports may require page breaks, consistent figure sizing, and control over floating tables.
PDF rendering: Requires a working LaTeX installation (e.g., TinyTeX).
Cross-format consistency: Settings that work for HTML might not suit PDF or Word outputs.
Citations and cross-references: Quarto supports citation management via BibTeX, but setup requires care.
Quarto also allows you to create presentations directly from .qmd files. Presentations use the same structure as documents but render slide-by-slide instead of page-by-page. You can choose from several output types:
Presentation Format
Output Type
Strengths
Challenges
revealjs
HTML slides
Highly flexible; supports transitions, incremental reveals, and embedded code or interactivity.
Requires attention to screen layout and readability; web-based only.
pptx
PowerPoint
Easy to share; editable after rendering.
Limited styling and dynamic features compared to HTML slides.
beamer
PDF slides (LaTeX)
High-quality printable slides; ideal for academic talks.
Below is an example of a simple Quarto presentation using the Reveal.js format.
The YAML header defines document metadata and output type, while the Markdown body defines the slide content.
Each slide begins with a heading (for example, ##) or is separated using ---. When rendered, Quarto executes any embedded R code chunks and displays their outputs, such as tables or plots, directly on the slides.
Students should keep slides concise: aim for clarity, minimal text, and meaningful visuals rather than dense explanations.
Common challenges for presentations:
Balancing detail and readability: Avoid overloading slides with text or long code blocks.
Consistent design: Use concise titles and uniform font sizes.